Ted Williams and the Sequence of Returns

Wednesday, May 15, 2019

Ted Williams and the Sequence of Returns

Ted Williams and Joe DiMaggio each hit a single on this date in 1941. It would turn out to be the beginning of career-best, longest hitting streaks for both. Ted Williams' hitting streak ended after 23 games. Joe DiMaggio, of course, went on to hit in 56 consecutive games — a record that still stands 78 years later.

DiMaggio won the MVP that year while Williams finished second, by a vote total of 291-254. Their 1941 accomplishments are widely considered to be two of the greatest performances in baseball history.

Despite missing out on the triple crown by 5 RBI (Joe DiMaggio led the league with 125 RBI), Ted Williams set his own record in 1941 that still stands today. He was the last baseball player to finish a season with a batting average above .400. Ted Williams’ batting average was .339 when his hitting streak began and rose to .431 when his streak ended on June 7. His average would briefly dip below .400 in July but remained above .400 in August and September. He ended the season batting .406.

In an amazing feat of consistency — Williams' longest hitless stretch in 1941 was 7 at-bats. And yet he was hitless in 30 of the 143 (21%) games he played in that year.

Which leads us to the importance of the sequence of returns when evaluating investments. Hitting .406 for the season is equivalent to going 2 for 5 every game. But they are equivalent, not the same — especially for the fans who attended one of his 30 hitless games. Williams went 2 for 5 in only 4 of the 143 games he played that season.

chart: Rolling 30-Year Annualized Returns

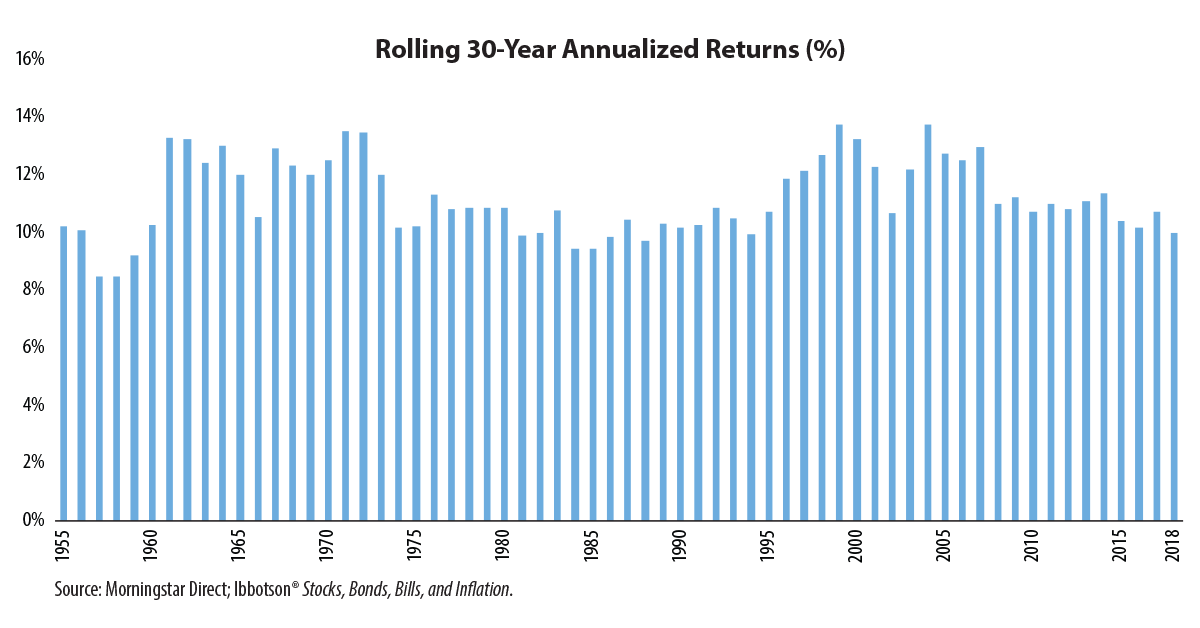
Similarly, using Dr. Roger Ibbotson’s long-term stock market returns, the rolling annualized 30-year total return of large company stocks has averaged 11.2% since 1926. And yet none of the 92 years had a calendar year return of exactly 11.2%.

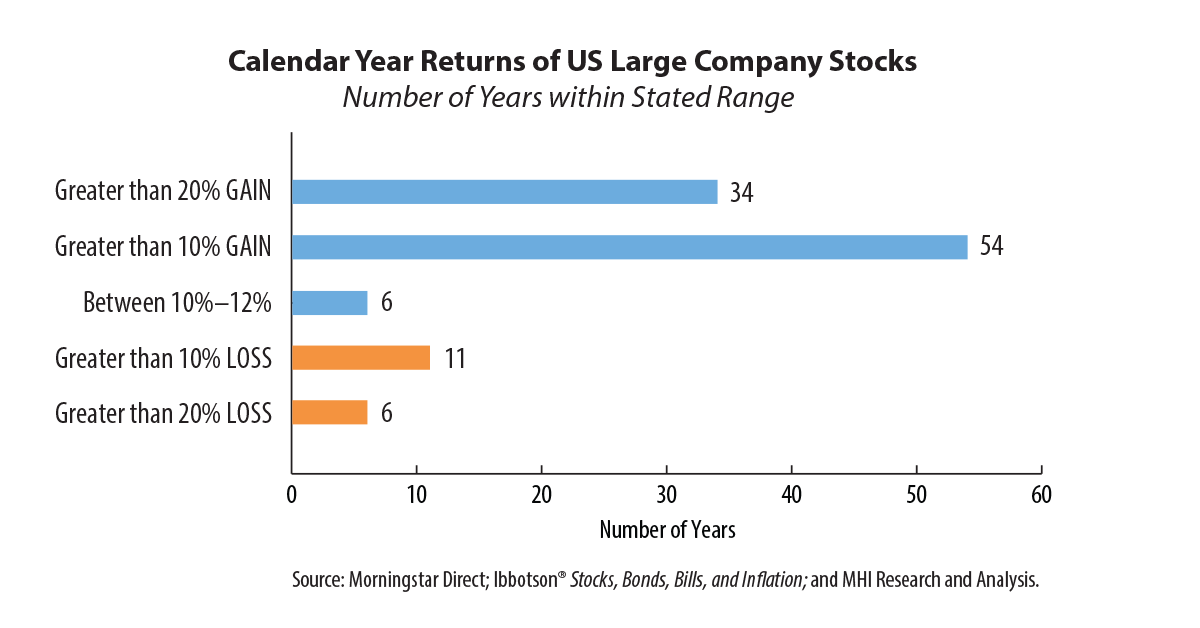
In fact, large company stocks returned between 10%-12% in only six calendar years.

Real world results for individual investors may have deviated from long-term averages depending on their entry point and the sequence of returns. In individual calendar years, investors were just as likely to see returns of -20% and much more likely to see returns of +20%.

chart: dividend gains over 60 years

The distinction becomes more important for investors harvesting income from their equity portfolios. Assuming a 5% withdrawal rate with annual withdrawals adjusted for inflation, and using Ibbotson’s large company stock returns, investors would have run out of money in 10 of 63 rolling 30-year periods.

chart: Market Value over 30 Years with 5% Annual Withdrawal, $1 Mil Starting Investment in Year, Annual withdrawals adjusted for inflation

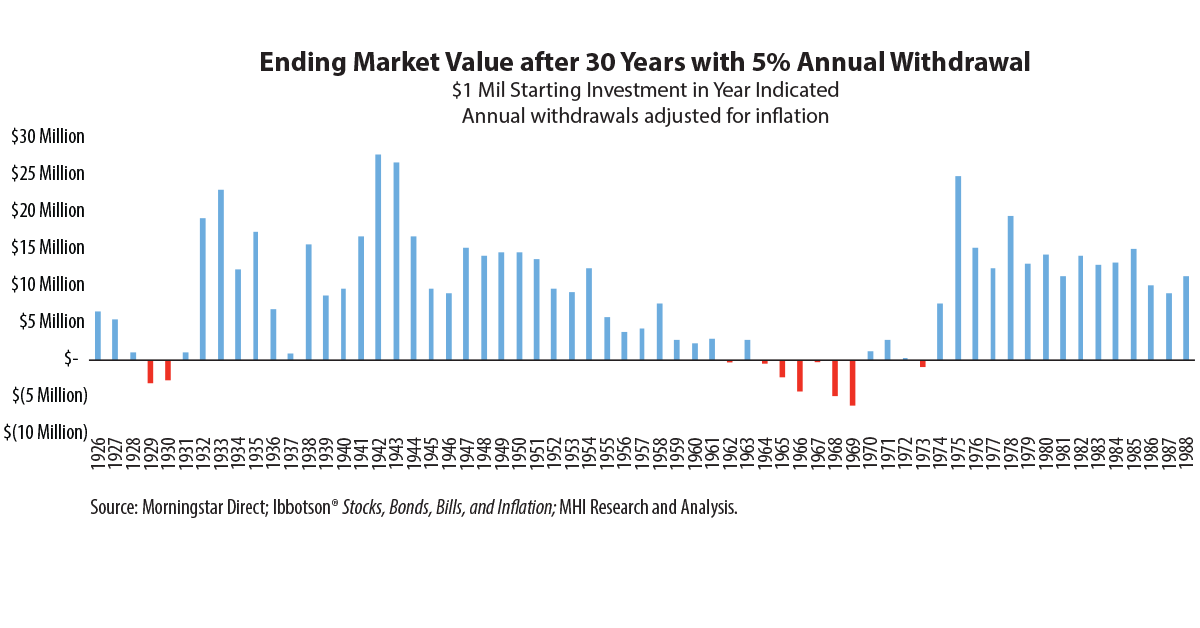
Looking at 1926-2018, the chart below shows total returns for the 10 instances when money would have run out before the 30-year period ended (years shown in red bars in chart above).

chart: Annualized 30-Year Total Return

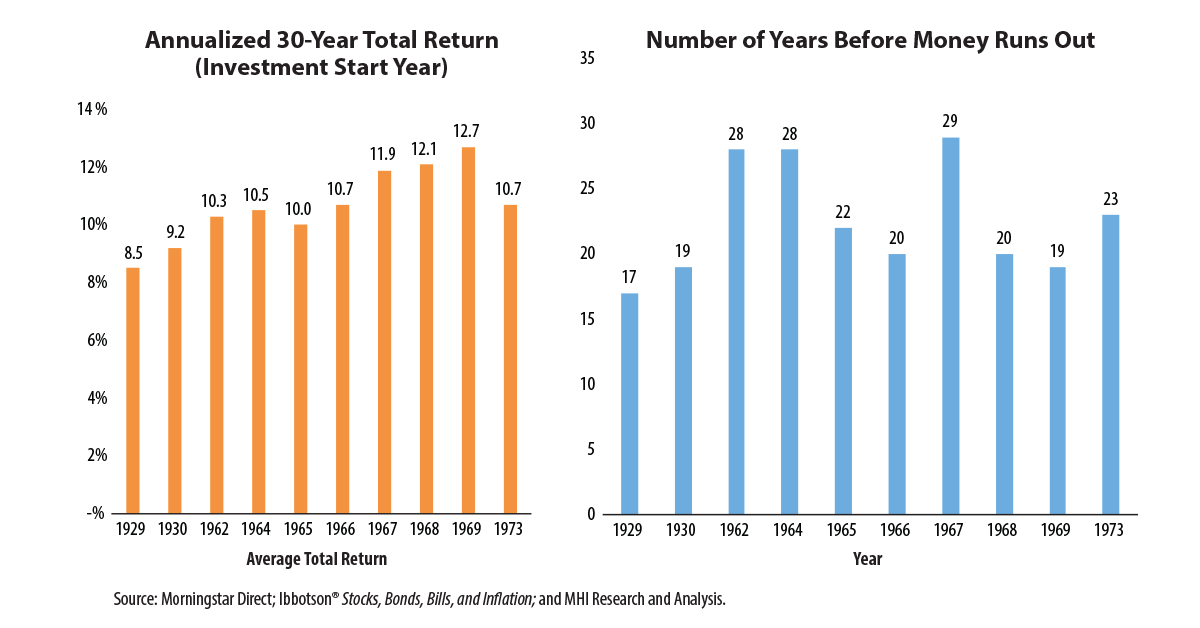
High inflation during the 1970s was a powerful force, but the sequence of returns was an important factor. Large company stocks returned 11.9% annualized in the 30-year period starting in 1967, almost identical to the 12.1% annualized return in the 30 years starting in 1968. And yet the investor starting in 1967 ran out of money in year 29 while an investor starting in 1968 would have exhausted their portfolio in year 20. The reason for this 9-year disparity was a 20% return in 1967, which the 1968 investor missed by 1 year.

Put another way, the hypothetical investor would have run out of money in retirement, in essence batting .000, in 16% of the 30-year periods — though you would never have guessed it by looking at total returns for these periods.

The accumulation phase of an investor’s lifecycle has dominated discussion in the financial industry — but tools to analyze the wealth spend-down phase are lacking in comparison.

We believe, for investors nearing or entering retirement, dollars are more important than percentages.

Definitions and Disclosure

Ibbotson® Large Company Stocks Index is represented by the S&P 500 Composite Index (S&P 500) from 1957 to present, and the S&P 90 from 1926 to 1956.
The Consumer Price Index (CPI) is a measure of the average change over time in the prices paid by urban consumers for a market basket of consumer goods and services. Indexes are available for the US and various geographic areas. Average price data for select utility, automotive fuel, and food items are also available.

Sources:
Ibbotson® Stocks, Bonds, Bills, and Inflation.

Baseball-reference.com


Catherine Johnston, CFA, is responsible for oversight of Miller/Howard's sales and marketing departments. She also serves on Miller/Howard's Executive Committee and as president and trustee of the Miller/Howard High Income Equity Fund. Prior to her promotion to Chief Marketing Officer, Catherine was a portfolio specialist at the firm, where she acted as liaison between the investment team and the sales and marketing teams. Before joining Miller/Howard in 2016, she worked as a portfolio analyst at AllianceBernstein LP in New York. Catherine received her BA with a double major in Mathematics and Psychology from Hamilton College, Clinton, NY.
Full Bio (PDF)

DISCLOSURE

INVESTMENT PRODUCTS: ARE NOT FDIC INSURED - MAY LOSE VALUE - ARE NOT BANK GUARANTEED

Opinions and estimates offered constitute Miller/Howard Investments' judgment and are subject to change without notice, as are statements of financial market trends, which are based on current market conditions. Nothing stated herein, including the mention of specific company names, should be construed as a recommendation to buy, hold, or sell any security, sector, or MLPs in general. To receive a list of all recommendations for the previous year, please email compliance@mhinvest.com. All investments carry a certain degree of risk, including possible loss of principal. It is important to note that there are risks inherent in any investment and there can be no assurance that any asset class will provide positive performance over any period of time. The material may also contain forward-looking statements that involve risk and uncertainty, and there is no guarantee they will come to pass.

Common stocks do not assure dividend payments. Dividends are paid only when declared by an issuer’s board of directors, and the amount of any dividend may vary over time. Dividend yield is one component of performance and should not be the only consideration for investment.

The information above is from sources deemed to be reliable and is provided strictly for the convenience of our investors and their advisors. These materials are solely informational. Legal, accounting and tax restrictions, transaction costs, and changes to any assumptions may significantly affect the economics of any transaction.

The information and analyses contained herein are not intended as tax, legal, or investment advice and may not be appropriate for your specific circumstances; accordingly, you should consult your own tax, legal, investment, or other advisors, at both the outset of any transaction and on an ongoing basis, to determine such appropriateness. Any investment returns — past, hypothetical, or otherwise — are not indicative of future performance.

Investment Decisions: Do not use this report as the sole basis for investment decisions. Do not select an allocation, investment discipline, or investment manager based on performance alone. Consider, in addition to performance results, other relevant information about each investment manager, as well as matters such as your investment objectives, risk tolerance, and investment time horizon.

The returns on a portfolio that utilizes environmental, social, or governance (ESG) criteria for stock selection may be lower or higher than portfolios where ESG factors are not considered, and the investment opportunities available to such portfolios may differ.

Past performance does not guarantee future results.

© 2024 Miller/Howard Investments.