Depend on Dividends and Earnings Growth, Not Multiple Expansion
Wednesday, March 31, 2021

Watching the short-term gyrations of the stock market can leave long-term investors wondering, “Is this really investing?” This quarter brought us the latest crazy example, GameStop, which started out below $20, shot above $300, came down sharply and continued to fly up and down, all based on essentially no news that would be of note to a serious long-term investor. However, the vicissitudes of the short term can mask the fundamental basis of long-term stock market returns. Despite the volatility in both single stocks and the overall market, long-term results do point to a fundamental basis for investment returns. Only by understanding what drove results in the past and how that might be different going forward, can we confidently invest for the long term.
The graph below shows the annual investment returns of the S&P 500 Index going back to 1993. We have decomposed returns into dividends, growth in expected earnings, and the change in the forward price-to-earnings (P/E) multiple.
Observations:
- Dividends are always positive, and the yield on the broad market is steady.
- Earnings increase in most years, consistent with a growing economy. Earnings growth does, however, vary much more than dividend returns.
- P/E multiples soar and plunge, causing much of the variation in stock market returns.
Stock market investors are so used to fluctuations in P/E multiples driving variations in returns that they rarely pause to consider how remarkable the concept is. Suppose you are considering buying a small business—how would you calculate your potential return? The first consideration would be the annual income the business would provide you. Second, you would want to forecast how fast earnings will grow—clearly a critical element of investment returns. Lastly, you may think about any change in how much other investors might be willing to pay for a dollar of earnings. The last point sounds like an afterthought until you realize that this is the P/E ratio, the primary fuel for stock market debates.
Contribution to Returns: Dividends and Earnings Growth Have Been More Reliable
S&P 500 Index Calendar Year Total Returns and Composition
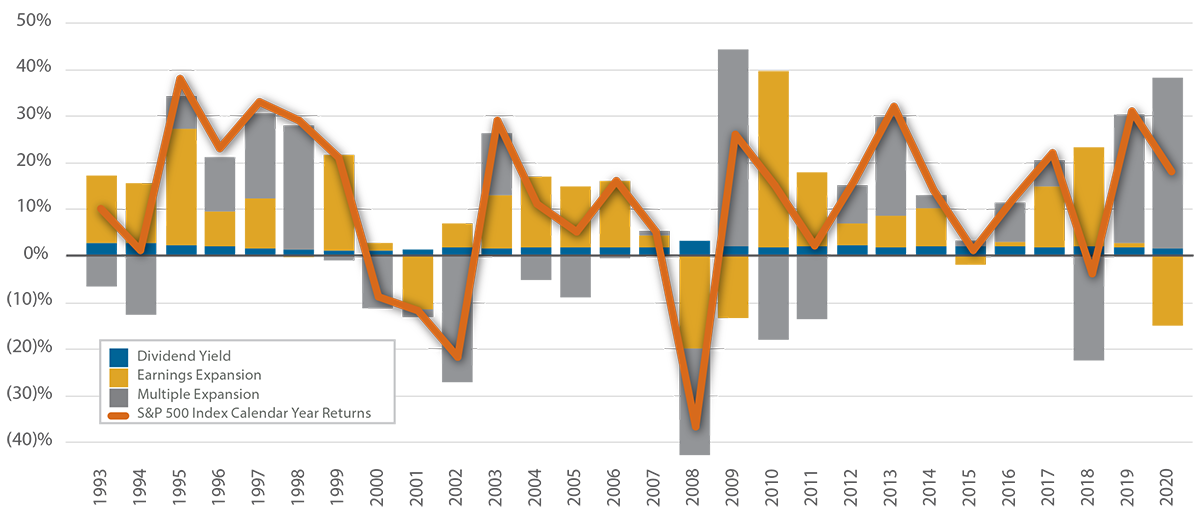
As of December 31, 2020. Source: Bloomberg.
The good news for long-term investors is that while changes in P/E multiples are important in the short term, they have not dominated long-term returns. The chart below shows the annualized decomposition of the S&P 500 returns over 1993-2020, the same years shown in the calendar year graph on the first page. Despite the drama that P/E changes cause year-to-year, the impact on S&P 500 returns during the entire period has been less than the dividend yield and less than a quarter of earnings growth.
Historic Mix of Stock Market Returns
S&P 500 Index Total Returns and Composition
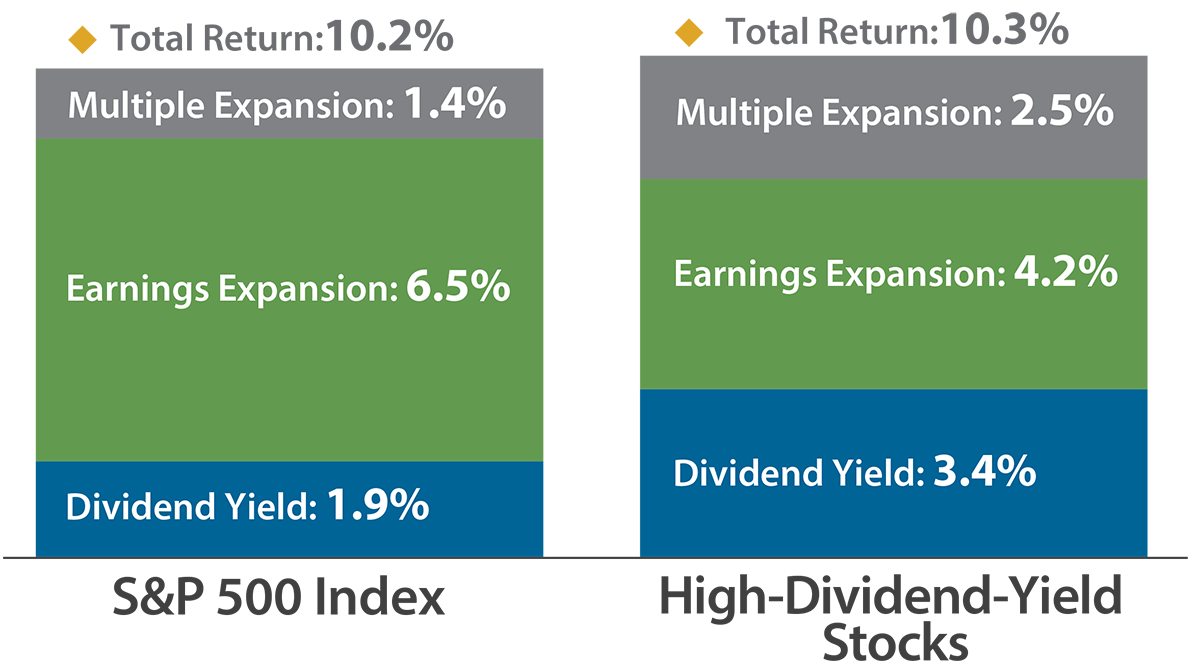
Data: 12/31/1992-12/31/2020, annualized.
Source: Miller/Howard Research & Analysis. High-dividend-yield stocks are defined as members of the S&P 500 Index that fall within deciles 7 thru 9 by dividend yield (with 1 being lowest; 10 highest). Members without an available historical estimated forward P/E have been excluded from the group.
In summary, the broad market has offered good but volatile returns with roughly a fifth of return coming from dividends, a seventh from multiple expansion, and fully two-thirds from earnings growth. We will argue that the future will look quite different, but let’s first look at the historic decomposition of returns for high-dividend-yield stocks. As you can see, the overall return for high-dividend-yield S&P 500 stocks is a tad higher than the S&P 500 for this period. This should not be a surprise—in Miller/Howard’s Q3 2020 Quarterly Report (on page 5), we showed that high-dividend-yield stocks have had better long-term returns over many decades compared to the S&P 500. The important point here is that the mix of return factors for high-dividend-yield stocks has been substantially different. As expected, dividend yield is a larger component of return, but what may be surprising is that multiple expansion has been a larger component for high-dividend-yield stocks than for the market as a whole.
This is only surprising because it runs counter to recent history. The chart below shows how the average P/E for the broad market has soared in the past two years, driven by significantly greater multiple expansion for the most expensive quintile of stocks.
Similar to the Tech Bubble, Today’s High Valuation Is Driven by the Most Expensive Stocks
S&P 500 Index: Forward P/E
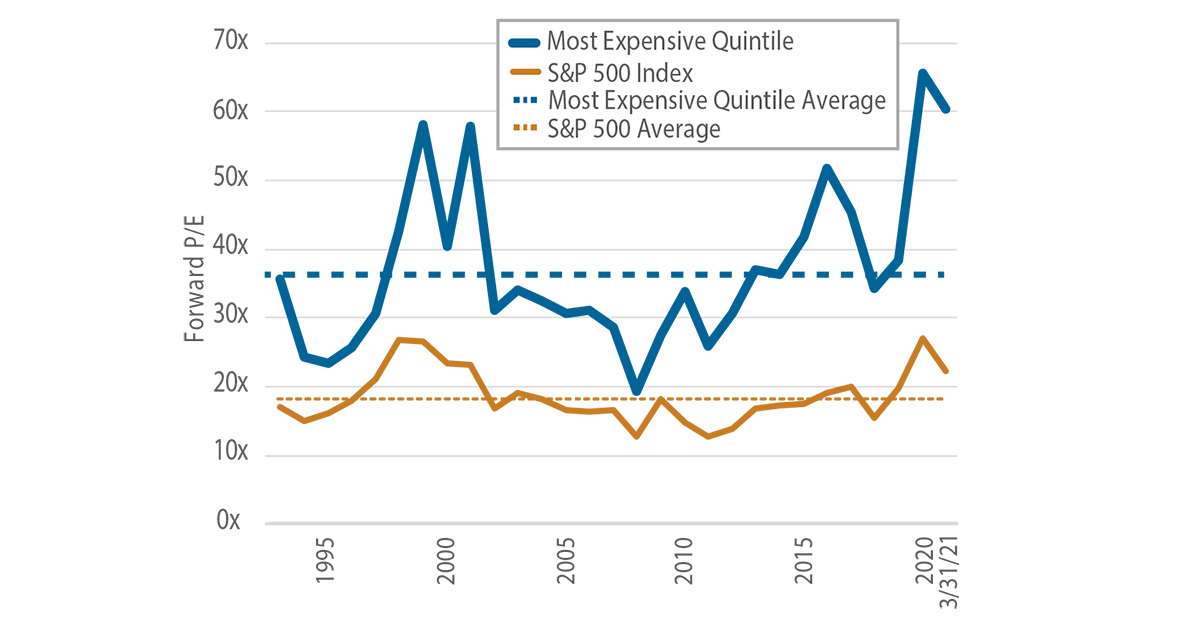
As of March 31, 2021. Source: Bloomberg; Miller/Howard Research & Analysis.
Time will tell how this plays out, but the graph looks suspiciously like the P/E expansion that occurred during the Internet/New Economy Bubble in the late 1990s. The P/E graph for high-yield stocks is less dramatic but has grown over time simply because interest rates have trended down. At Miller/Howard, we favor high-yielding stocks with the potential for significant earnings growth, but a material number of high-dividend payers can be considered bond proxies—companies with little earnings growth but steady dividends. As bond prices have inflated over the long term, it follows that the prices of bond proxies would keep pace. As evidence, the graph on the left shows that the P/E of the two sectors with the most bond proxies, utilities and consumer staples, have indeed inflated over time.
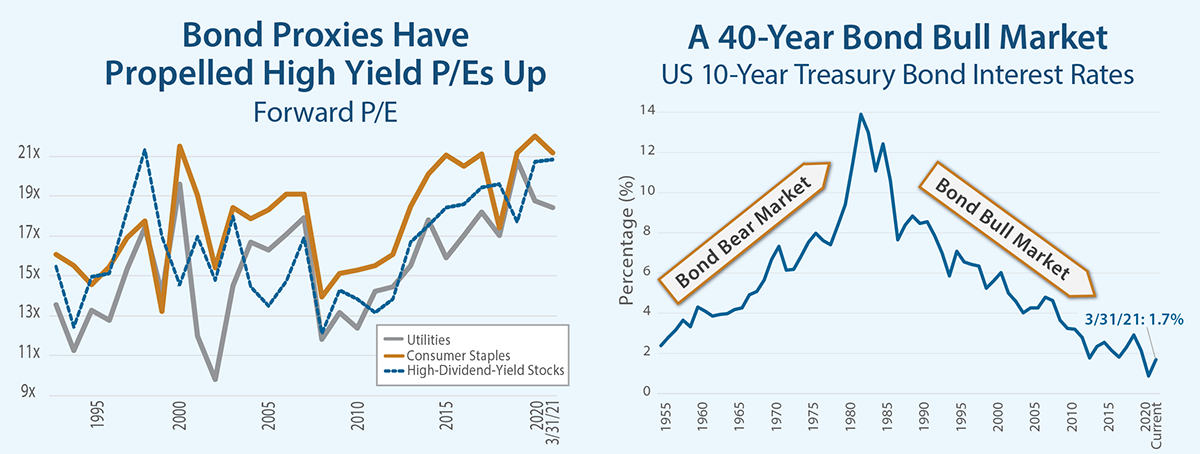
As of March 31, 2021.
Sources: Bloomberg; Federal Reserve Bank of St. Louis (FRED); Miller/Howard Research & Analysis. Bond proxies are represented by utilities and consumer staples. High-dividend-yield stocks are defined as members of the S&P 500 Index that fall within deciles 7 thru 9 by dividend yield (with 1 being lowest; 10 highest).
The Tide May Be Turning for P/E Expansion
Historic returns are interesting, but what we really care about is future returns. Looking out over the coming decades, we expect dividends and earnings growth to remain important for investment returns, but we expect the returns from P/E multiple expansion to be zero at best.
Naturally, P/E expansion and contraction will continue to cause year-to-year fluctuations, but we expect zero or even negative returns from P/E multiple changes over the longer term. Why? First, higher P/Es come from ascribing more value to earnings in distant years. When considering a single stock, clearly investors can become more optimistic about earnings in the outer years, but is that plausible for the market as a whole? A much simpler explanation for higher average P/Es is the long-term downward trend in interest rates, causing distant earnings to be less discounted. This implies that ever-higher market multiples would require even lower long-term interest rates–an unlikely prospect given their low starting point today.
No doubt you can find an experienced equity investor who says something like, “I don’t link stock prices and interest rates. Things get better over time. I’ve been doing this for forty years and have developed intuition.” But forty years is not enough! We’ve been in a bond bull market for forty years. The entire career of most equity investors has taken place while long-term interest rates have trended down. How can you trust your intuition on multiple expansion when it has been trained in a largely one-way market?
Despite the recent run-up in interest rates, bond prices are volatile enough that no one can say for sure that the 40-year bond bull market is over. There are strong indications, however, that we may be at a turning point. Last August Federal Reserve Chairman Jerome Powell announced that the Fed would target an average of 2% inflation, allowing inflation to run over 2% for periods of time without policy adjustments. This could prove to be a big change from treating the 2% inflation target as effectively a third rail—tightening before touching it. Another reason to be bearish on long-term bonds is the significant increase in spending in response to the pandemic. This will require a large increase in bond supply, much of it at the long end. The market will likely require higher rates to absorb the new issuance.
The second reason investors should not depend on returns from multiple expansion is that we are beginning from an already high P/E. As a point of reference, the forward P/E for the S&P 500 at the end of 2020 was higher than at the end of either 1998 or 1999. Gray-haired investors remember the late 1990s well, and will recall many similarities. Many large-cap companies, such as Microsoft and Cisco, were going to change the world, and arguably did, but proved to be poor investments for years following their peaks. Today we have many equally exciting companies, but investors have always reached a limit on the P/E multiples they are willing to pay. Combining this argument with the nascent trend towards higher long-term interest rates, it seems much more likely that the S&P 500’s P/E will average below recent highs, not above.
But market P/E multiple compression does not necessarily portend poor investment results—it just means that investors need a plan with regards to all three return factors. The chart below shows the sources of investment return for the S&P 500 and high-dividend-yield S&P 500 stocks over time. At first blush, you might be pessimistic, thinking that dividend yields are low relative to your total return expectations, earnings growth is volatile, and P/E changes are even more volatile and likely to be negative going forward. We view it differently.
Miller/Howard’s View on the Sources of Investment Returns

As of December 31, 2020.
Source: Bloomberg; Miller/Howard Research &Analysis. High-dividend-yield stocks are defined as members of the S&P 500 Index that fall within deciles 7 thru 9 by dividend yield (with 1 being lowest; 10 highest). Members without an available historical estimated forward P/E have been excluded from the group.
The graph below shows the distribution of forward P/Es across the stocks in the S&P 500 weighted by market cap. Remarkably, 8% are trading at a multiple above 50x. Cumulatively, 24% of the value of the S&P 500 is currently in stocks that trade at more than 30x this year’s expected earnings—a historically high number. These are the stocks that we think are most at risk of multiple compression, as rising interest rates reduce the value of their decade-out earnings projections, even if those often-rosy assumptions are realized. But also note the other end of the graph. There are plenty of stocks with P/Es well below the market average of 27x. We believe that the best defense against multiple contraction is constructing portfolios of stocks with high dividend yields and earnings growth potential that are trading at reasonable valuations.
Percent of S&P 500 Index Stocks with Expensive Valuations at a Historic High
Market Cap Weighted
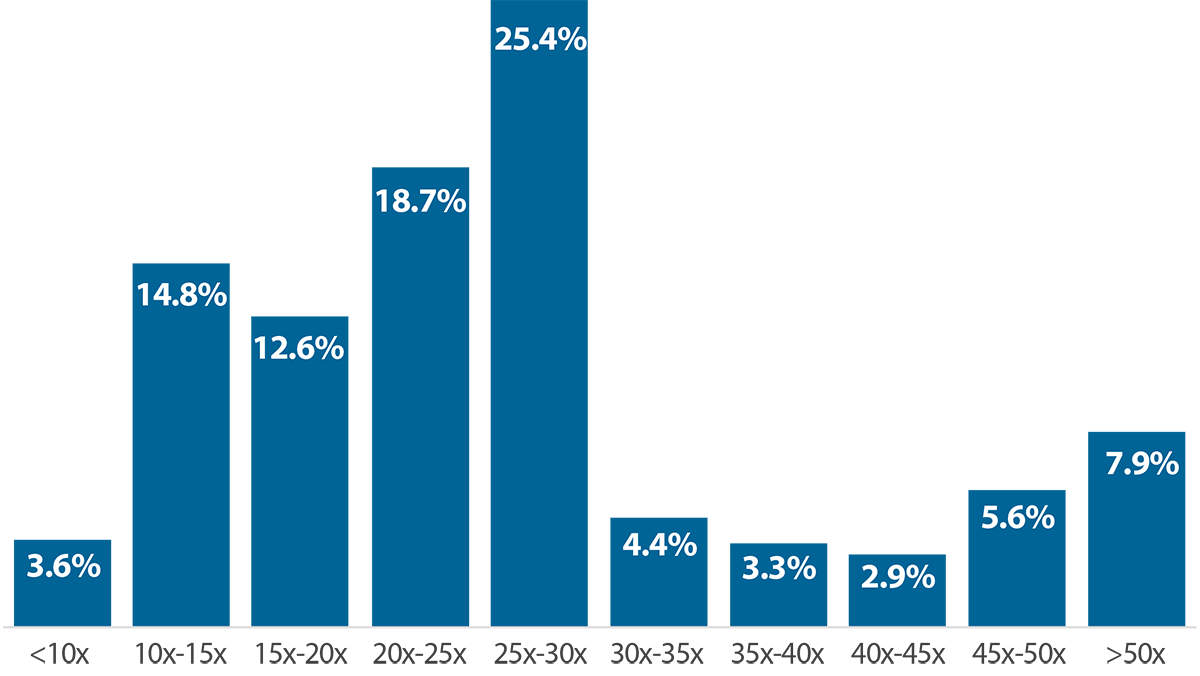
As of March 31, 2021. Based on forward P/E. Source: Bloomberg; Miller/Howard Research & Analysis.
Overall, we continue to be optimistic that the stock market will remain a good source of both income and total returns. Returns in the last couple of years have been dominated by P/E multiple expansion. It’s easy to get caught up in the stampede towards expensive stocks. But bear in mind that multiple expansion has not been the principal driver of long-term investment returns over the last few decades, and it is quite likely to be negative for the overall market going forward.
Timing the drop in the market multiple is tricky, but we are confident that portfolios focusing on dividends and earnings growth can navigate these difficult waters, generating both dependable high-and-growing income and total returns.
Read the 1Q 2021 Quarterly Report ►

Emeritus CIO
