Dividends, Valuations, and Mathematics
Tuesday, February 11, 2025

Why do high-yield stocks have lower valuations—and why does it matter? We walk through the math of how High Dividend Yield multiplied by High Dividend Coverage equals Low P/E, and we also compare historic market valuations with the future total returns.
Investment research has memes—they're not always as flashy as the latest meme stock, but they still make you think. One historically-based meme that has been passed around in investment research circles lately compares historic market valuations with the future total returns. It shows that if you bought the S&P 500 Index at lower valuations (here, looking at forward price-to-earnings or "P/E" ratios), your future total returns would have been higher, and vice versa. For example, if you had bought the S&P 500 when the forward P/E was around 12x, you would have earned returns somewhat above 15%. If you had bought the S&P 500 when the forward P/E ratio was around 25x, you would have lost money over the next 10 years.
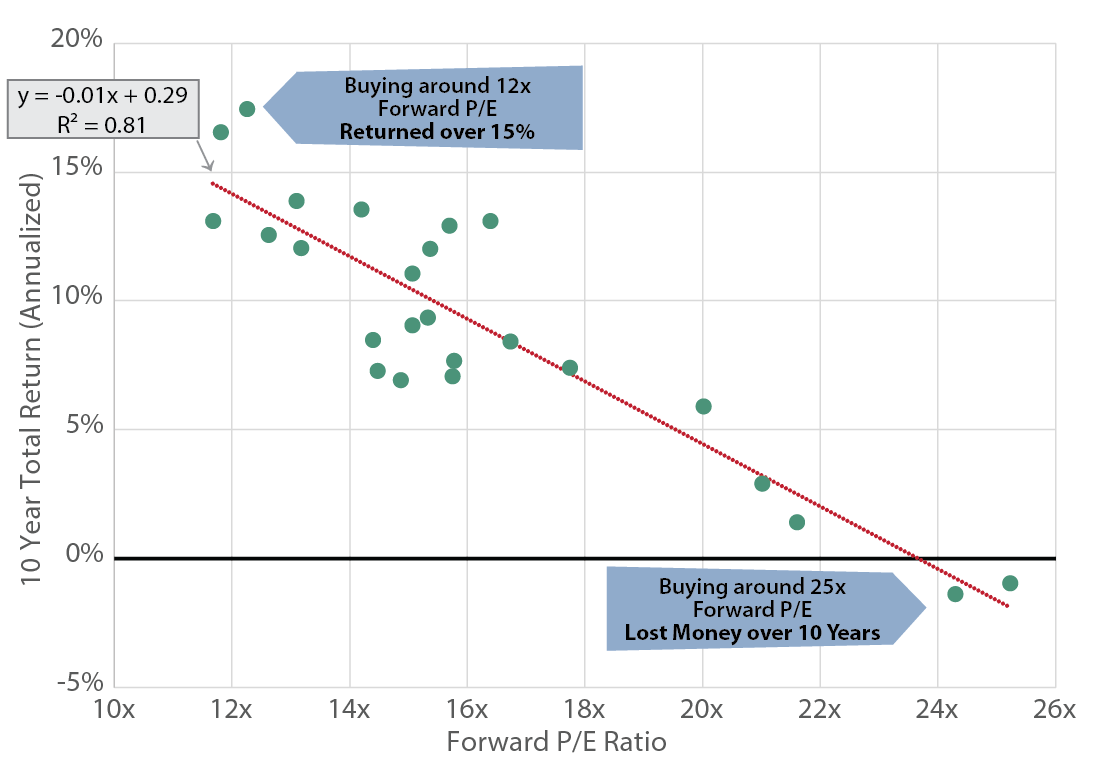
As of December 31, 2024. Sources: Bloomberg; Miller/Howard Research & Analysis.
This chart could be viewed by an investor as a recommendation for market timing. We would not make such a recommendation. There are plenty of very smart investors, but we'd be hard-pressed to name anyone who could consistently time the market. Sure, some predicted market tops (often calling several in row before the market finally declined), but then they missed when it was time to get back into the market and didn't profit from the rebound. This is why the Miller/Howard philosophy is built on an approach that rides out the unknowable spikes and dips and uses compounding dividend income to strive to maximize long-term returns.
Bear with us for a bit of algebra...we promise to bring it all together quickly.
Here at Miller/Howard, our Income-Equity portfolios seek high current income (from high-dividend-yielding stocks), growth of income (dividend growth), and financial strength (which includes low dividend payout ratios). Let's look at what this means.
| ( | Dividend | ) |
| Price |
| ( | Earnings | ) |
| Dividend |
| ( | Dividend | ) |
| Price |
| ( | Earnings | ) |
| Dividend |
| ( | Dividend ∗ Earnings | ) |
| Price ∗ Dividend |
Since we have Dividend on both the top and bottom of the fraction, they cancel each other out.
| ( | Dividend | ) |
| Price |
| ( | Earnings | ) |
| Dividend |
| ( | Earnings | ) |
| Price |
| ( | Earnings | ) |
| Price |
Now the English translation:
High Dividend Yield Multiplied by High Dividend Coverage Equals Low P/E
High dividend yield is a large dividend relative to a stock's price.
High dividend coverage is a large amount of earnings compared to the dividend paid to shareholders (a measure of financial strength and dividend safety).
Low P/E (also known as high earnings yield) means that earnings are large compared to the stock price.
Either way you look at it, if we are true to our mantra of "high current income, growth of income, and financial strength," we believe our Income-Equity portfolios should end up with a P/E ratio below the broad market.
Overlaying the current S&P 500's forward P/E ratio and Miller/Howard Income-Equity's forward P/E as of January 15, 2025:
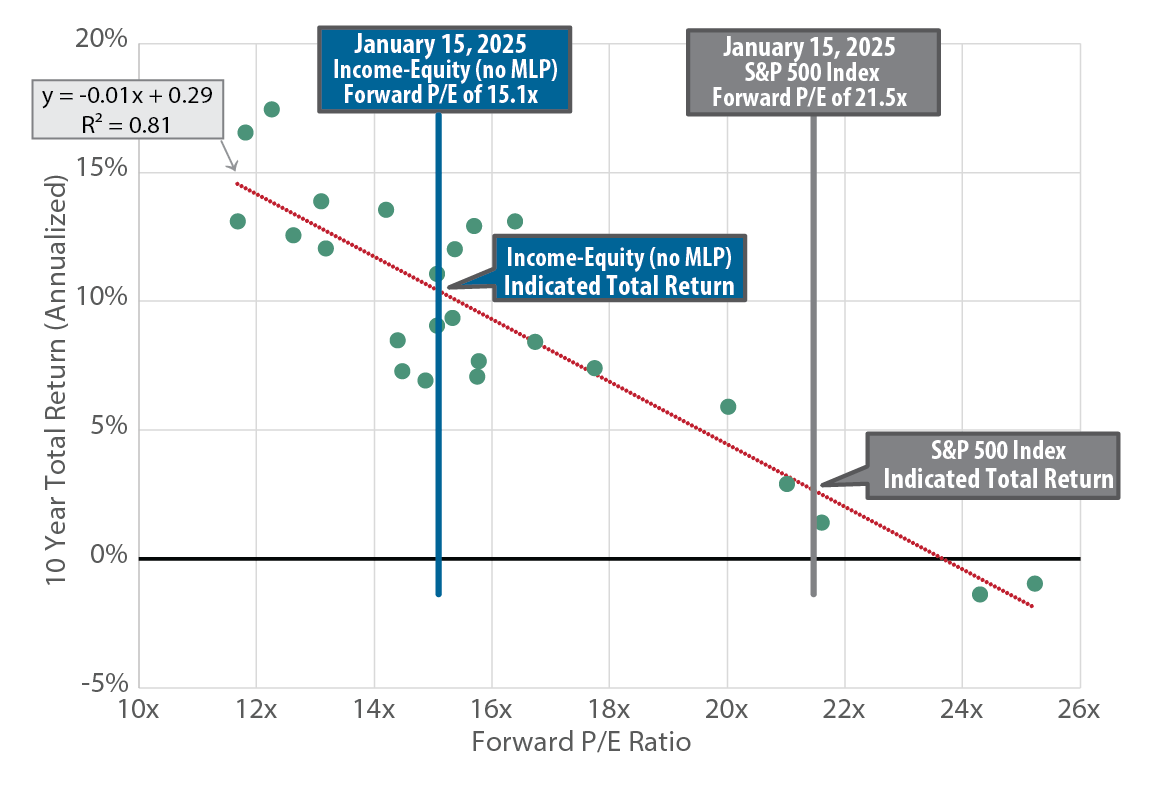
As of December 31, 2024. Sources: Bloomberg; Miller/Howard Research & Analysis. Indicated total return is where the Income-Equity (no MLPs) portfolio or S&P 500 Index's current valuation intersects with the regression line for historical returns.
Our portfolio's P/E is lower than the broad market, so we are fulfilling our commitment to our clients.
Rather than attempting to adroitly jump in and out of the market at just the right times, we believe in consistently investing in a market segment—high-dividend-yielding stocks—where history seems to be on the investor's side.

John (Jack) E. Leslie III, CFA, focuses on diversified, dividend-paying stocks. He is a member of Miller/Howard's Board of Directors. Prior to joining Miller/Howard in 2004, Jack was a portfolio manager at Value Line Asset Management, M&T Capital Advisors Group (a division of M&T Bank Corp.), and Dewey Square Investors Corp. (now part of Old Mutual Asset Management). Jack earned his BS in Finance from Suffolk University and an MBA from Babson College.
