
In 2025, two groups have dominated the financial headlines. The first, of course, is the information technology sector—the subject of daily breathless headlines on AI breakthroughs, spectacular growth prospects, soaring stock prices, and a few warnings that it all may be a bubble. The second, the pharmaceuticals industry, has faced the opposite: constant tariff threats, vaccine skepticism, regulatory pricing reforms, public frustration, and a constant shadow of government cost cuts. If you were to guess which one of these has been 2025's big winner in our Income-Equity portfolios… you'd likely be wrong!
Remarkably, through October 31, 2025, our four Income-Equity pharmaceutical holdings—Johnson & Johnson, GSK, Gilead, and AbbVie—have actually kept up with or outperformed both the NASDAQ Index and the S&P 500 Technology Index, and they have done so with roughly one-third less volatility. Overall, the broader pharma industry, that includes names not held in our portfolio, has not matched this performance, largely due to patent-cliff cycles and dampening enthusiasm for GLP-1s, among other factors.
What's driving this? In this piece, we'll explain why we like large-cap pharma, currently 17% of our Income-Equity portfolios (as of October 31, 2025). We'll unpack the substance behind the headlines and highlight what we're watching as the balance of risk and reward evolves.
Why Do We Like Large Cap Pharma?
We have managed our Income-Equity portfolios for nearly 30 years. Over that time, much has changed—trends have come and gone, economic environments have cycled—but our investment philosophy has not. Every investment we consider must meet a simple, three-part test: high current income, growth of income, and financial strength. It's a framework that's served us well through bubbles, busts, and everything in between. In short: Is the dividend meaningful? Will it grow? And is it safe? Pharmaceutical stocks have long fit this mandate and continue to do so now. Let's dig deeper.
High Current Income and Growth of Income
Money market yields have improved lately, but looming Fed rate cuts and persistent inflation suggest those gains won't last. Meanwhile, the S&P 500 Index's yield sits near a record low, approaching 1%. By contrast, our pharma holdings offer an average yield of about 3%, with roughly 6% projected growth, well ahead of inflation.
Financial Strength
In standard financial theory, the “risk-free” rate is that of US Treasury debt. Don't tell that to the ratings agencies, which count Johnson & Johnson as one of the only two AAA rated credits (the other being Microsoft, not held), a notch above the AA+ rated USA. In other words, when it comes to balance sheets, J&J could probably lend Uncle Sam a few bucks. Across our pharma holdings, low financial leverage offers crucial downside protection for dividends and flexibility for future research and development (R&D) or acquisitions, in our view. Beyond that, the earnings stability of our pharma holdings (second only to the utilities sector) further supports dividend durability.
Pharma & Biotech Offer Healthy Balance Sheets
Income-Equity (No MLPs) Pharma & Biotech Holdings vs. Select S&P 500 Sectors
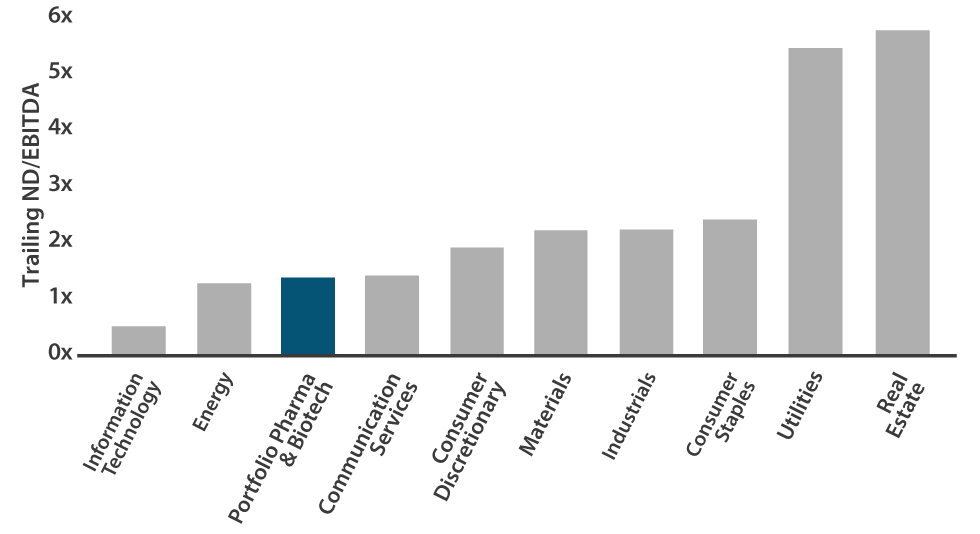
Sources: Bloomberg; LSEG; Miller/Howard Research & Analysis. Portfolio holdings and weights as of September 30, 2025. Data as of June 30, 2025. Weighted average trailing ND/EBITDA for Income-Equity (No MLPs) pharmaceutical and biotech holdings (ABBV, GILD, GSK, JNJ). Excludes financials as free cash flow is not a relevant metric for this sector.
Pharma & Biotech Provide Relatively Consistent Earnings
Income-Equity (No MLPs) Pharma & Biotech Holdings vs. Select S&P 500 Sectors
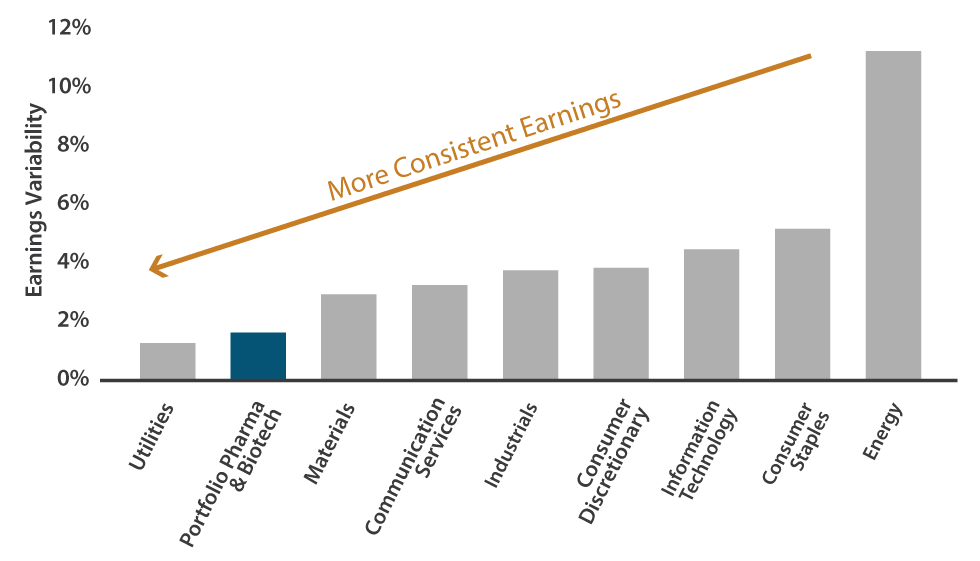
Sources: Bloomberg; LSEG; Miller/Howard Research & Analysis. Portfolio holdings and weights as of September 30, 2025. Earnings variability data are as of June 30, 2025. Weighted average earnings variability for Income-Equity (No MLPs) pharmaceutical and biotech holdings (ABBV, GILD, GSK, JNJ). Earnings variability is a weighted measure defined as the trailing 5-year standard deviation of revenue, trailing 5-year standard deviation of adjusted earnings, and trailing 5-year standard deviation of cash flow from operations, each divided by trailing 5-year median total assets (weighted by 31%, 34%, and 35%, respectively; weights of each ratio were determined using Bloomberg's methodology for calculating the earnings variability factor). Excludes financials and real estate as earnings variability is not a relevant metric for this sector. The healthcare sector is excluded, as we compare the portfolio's pharma and biotech holdings instead.
Low Market Sensitivity
Markets tend to move in cycles. When one sector is thriving, another often lags. That's why we feel that portfolio diversification is essential for consistent income growth. Even in recessions, when most industries slow, pharmaceuticals tend to hold steady. Their earnings, dividends, and share prices show low correlation to the broader economy. In short, pharma offers something rare: growth with built-in defensiveness. When the market catches a cold, pharma tends to barely sniffle.
Pharma & Biotech Demonstrate Low Market Sensitivity
Income-Equity (No MLPs) Pharma & Biotech Holdings vs. Select S&P 500 Sectors
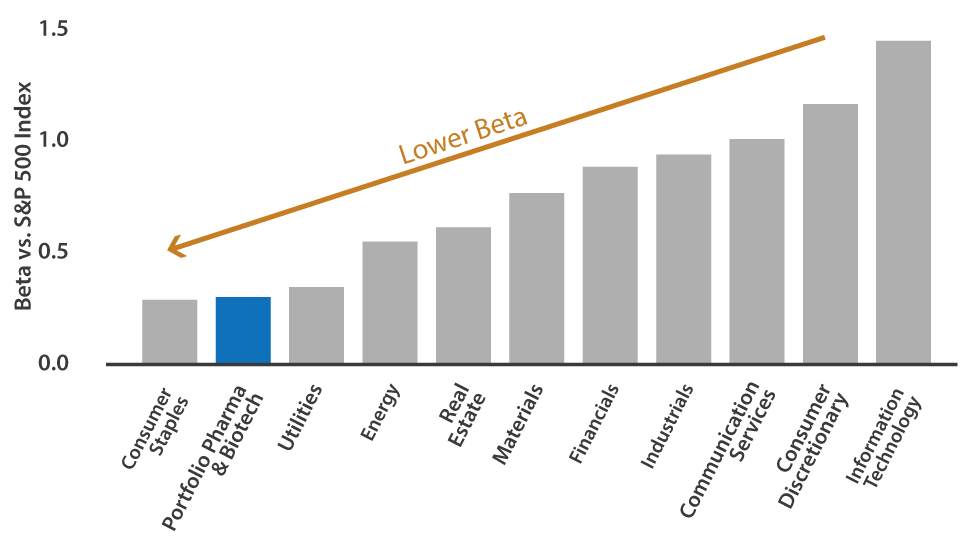
Sources: Bloomberg; LSEG; Miller/Howard Research & Analysis. Portfolio holdings and weights as of September 30, 2025. Data as of September 30, 2025. Weighted average beta for Income-Equity (No MLPs) pharmaceutical and biotech holdings (ABBV, GILD, GSK, JNJ). Beta uses 2-year, weekly returns data vs. the S&P 500 Index. The healthcare sector is excluded, as we compare the portfolio's pharma and biotech holdings instead.
Quintessential “Moats”
The pharmaceutical business model rests on a simple social contract: Companies risk enormous sums of shareholder cash in an uncertain search for medical breakthroughs. When they succeed, they're rewarded with roughly a decade of patent protection before generic competition takes hold. This longstanding and stable system encourages continuous innovation and better patient outcomes. At its core, profit as a percentage of total revenue is a quantitative representation of the scarcity value of a good or service. One measure of that value is free cash flow margin—the share of sales that becomes cash available for buybacks and dividends. On this measure, large-cap pharma stacks up very well.
Pharma & Biotech Are Market Leaders in Free Cash Flow (FCF) Generation
Income-Equity (No MLPs) Pharma & Biotech Holdings vs. Select S&P 500 Sectors
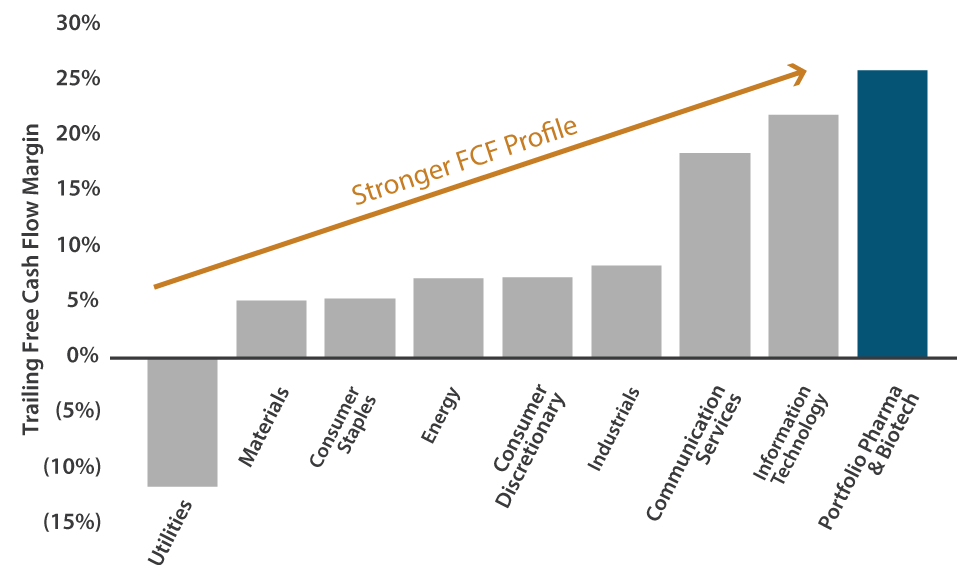
Sources: Bloomberg; LSEG; Miller/Howard Research & Analysis. Portfolio holdings and weights as of September 30, 2025. Data as of June 30, 2025. Weighted average free cash flow margin for Income-Equity (No MLPs) pharmaceutical and biotech holdings (ABBV, GILD, GSK, JNJ). Trailing free cash flow (FCF) margin is defined as cash flow from operations less capex divided by revenue. Excludes financials and real estate as free cash flow is not a relevant metric for these sectors. The healthcare sector is excluded, as we compare the portfolio's pharma and biotech holdings instead.
Valuation Remains Compelling
Even after the year-to-date 2025 gains, our pharma holdings remain among the market's most attractively valued on a forward earnings basis. While forward price-to-earnings (forward P/E) isn't a perfect measure for this industry, the balance of risk and reward still looks highly favorable.
Pharma & Biotech Valuations Remain Compelling
Income-Equity (No MLPs) Pharma & Biotech Holdings vs. Select S&P 500 Sectors
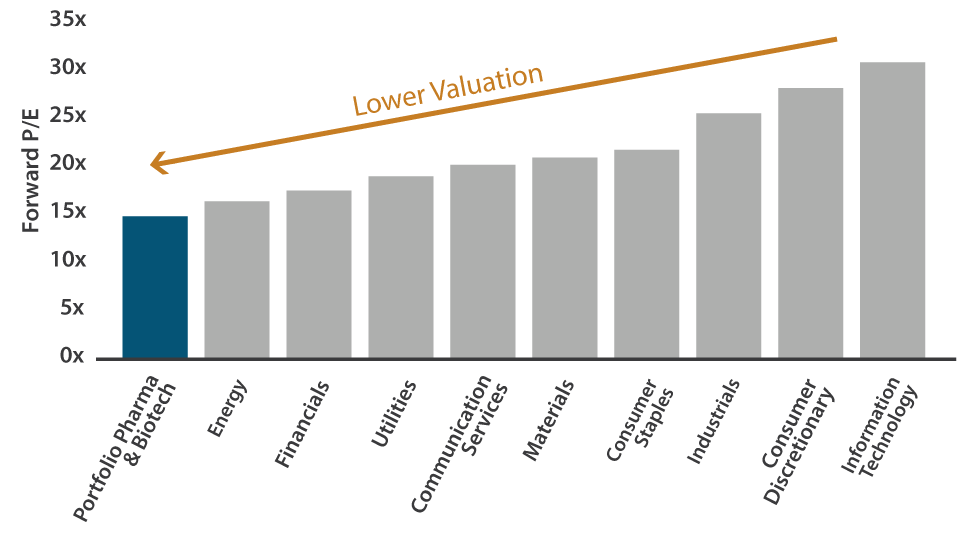
Sources: Bloomberg; LSEG; Miller/Howard Research & Analysis. Portfolio holdings and weights as of September 30, 2025. Data as of September 30, 2025. Weighted average price-to-earnings (P/E) (NTM) for Income-Equity (No MLPs) pharmaceutical and biotech holdings (ABBV, GILD, GSK, JNJ). Excludes real estate as P/E is not a relevant metric for this sector. The healthcare sector is excluded, as we compare the portfolio's pharma and biotech holdings instead.
And Of Course, Artificial Intelligence
On average, our pharma holdings devote 19% of sales (and more than half of profits) to developing new treatments, totaling roughly $39 billion across the four companies in 2025. Historically, about 90% of pharma R&D spending has failed to yield marketable discoveries. AI could change that. By rapidly identifying new treatment pathways and optimizing molecular design, AI has the potential to transform productivity. Even a modest 10% boost in R&D efficiency could meaningfully expand profitability.
Research & Development as a % of Revenue
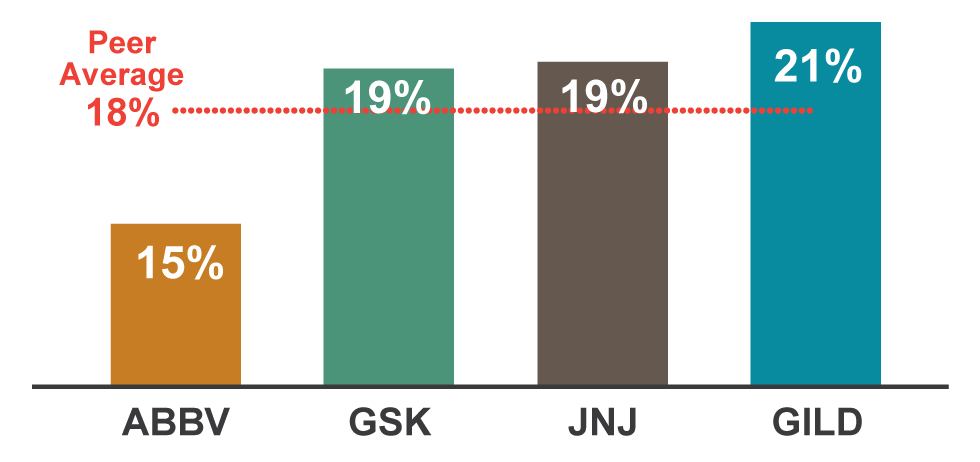
Full year 2024 data as of December 31, 2024. Sources: Company filings; LSEG; Miller/Howard Research & Analysis. Peer group: BMY, GILD, PFE, MRK, NVS, ABBV, JNJ, AMGN, VTRS, GSK, SNY, AZN. ABBV, GILD, GSK, and JNJ were held in the Income-Equity (No MLPs) portfolio as of September 30, 2025.
Parsing the Scary Headlines
None of this is risk-free. In 2025, the pharmaceutical industry has become a prime focus of the Trump administration's healthcare reform agenda. Below, we break down the major threats—where they stand today, and what we're watching next.
Import Tariffs
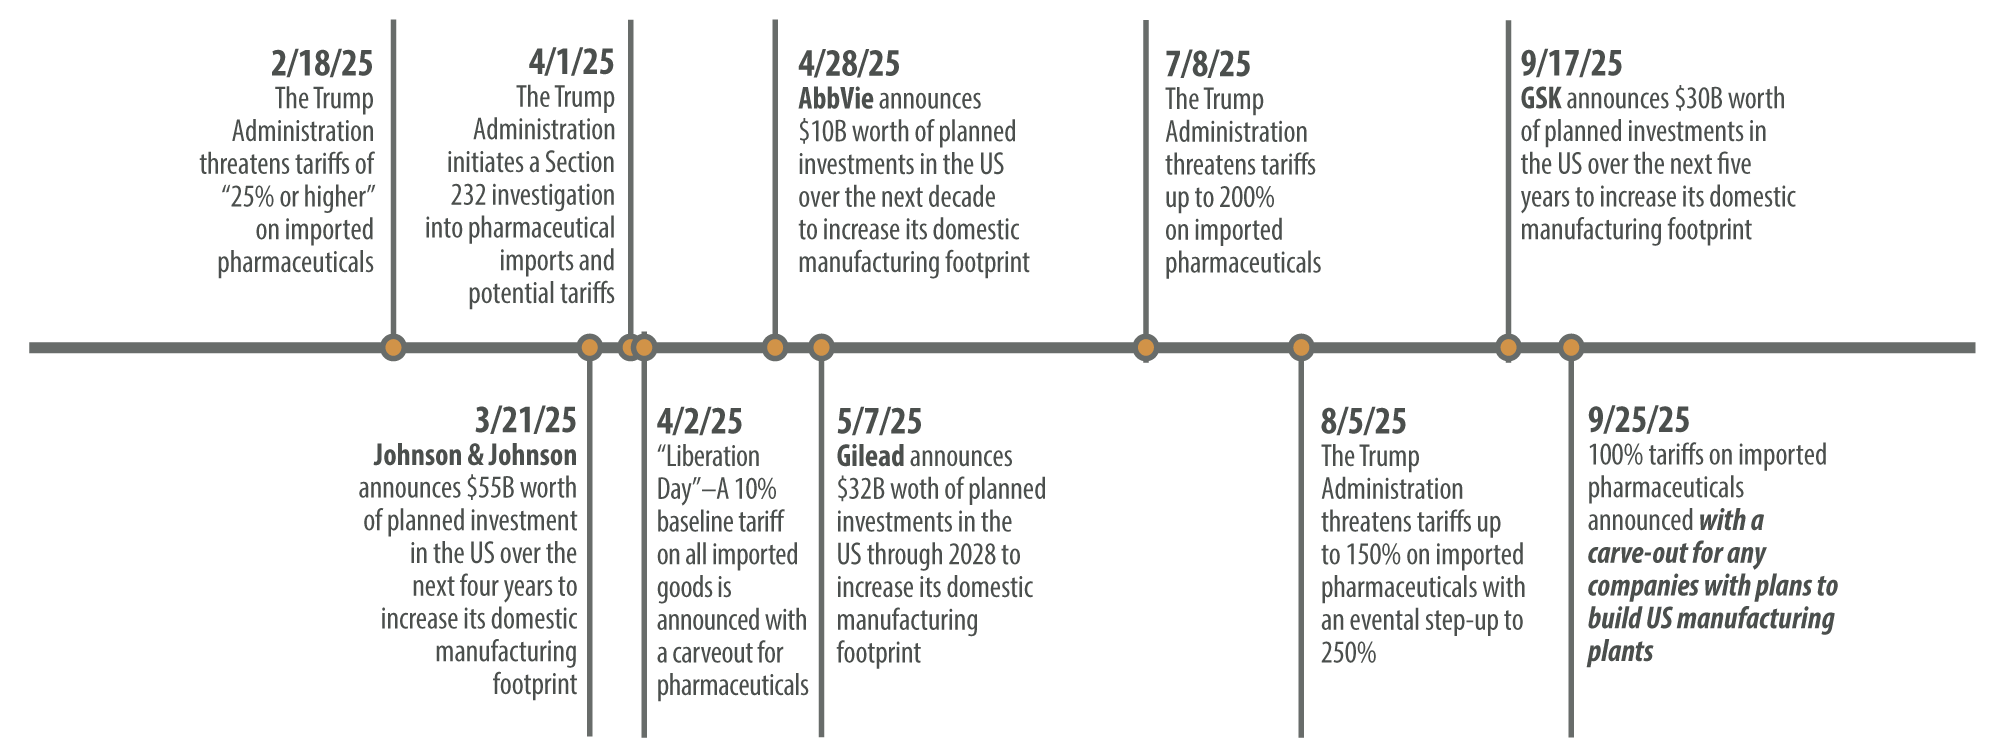
The Administration has spotlighted pharma's long history of lowering costs and taxes by shifting production and profits overseas. Yet, in reality, imposing tariffs on already expensive prescription drugs is politically unrealistic, in our opinion. Despite harsh rhetoric, the industry remains somewhat uniquely exempted from the 10% baseline tariff on most imported goods. The proposed 100% pharma-specific tariffs appear aimed more at securing corporate reshoring pledges than actual enforcement. For now, we view our pharma holdings to be safe, with more than $120 billion in such long-term “commitments” already announced by our holdings this year (most of which would have been spent anyway).
Announced US Investment Plans

Company announcements as of October 31, 2025. Sources: Company filings; Miller/Howard Research & Analysis. ABBV, GILD, GSK, and JNJ were held in the Income-Equity (No MLPs) portfolio as of September 30, 2025.
Reshoring Should Shield Pharma from Tariffs
Current tariff policy now includes key carve-out for domestic investment
Data as of October 31, 2025. Sources: US Dept. of Commerce; Reuters; CNBC; company filings & communications; Miller/Howard Research & Analysis. AbbVie, Gilead, GSK, and Johnson & Johnson were held in the Income-Equity (No MLPs) portfolio as of September 30, 2025.
Most Favored Nation (MFN) Pricing
Unlike tariffs, the political case for lowering drug prices is straightforward. Americans know they pay far more for prescriptions than patients overseas—and that frustration runs deep. The Trump administration's “Most Favored Nation” (MFN) proposal aims to prevent US consumers from paying higher prices than foreign buyers. That sounds ominous for pharma, but in practice, MFN lacks real enforcement power without new legislation. For now, the administration has taken a more pragmatic tack—working with the industry to raise foreign prices modestly, creating space for revenue-neutral price reductions at home.
Relative Branded Drug Pricing in the United States vs. Other Developed Nations
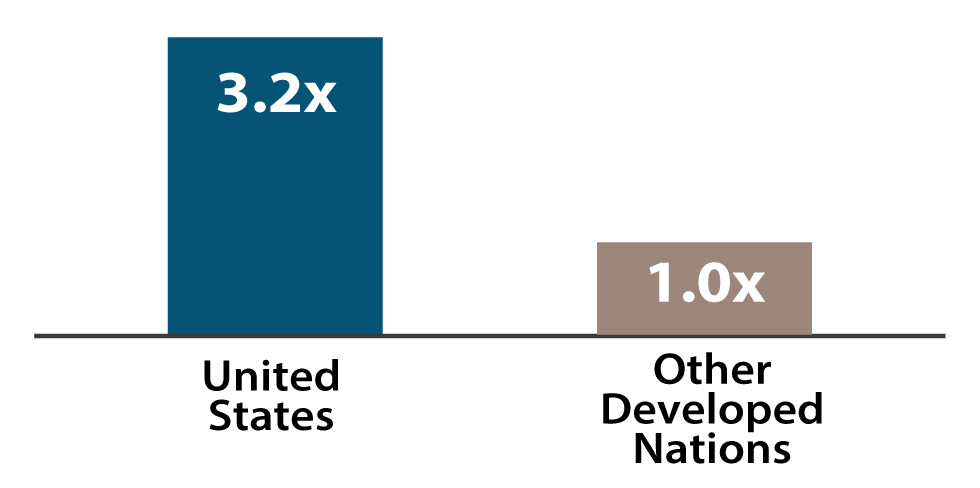
Data as of 2022. Sources: US Department of Health & Human Services (HHS). Other Developed Nations are defined as other countries in the Organisation of Economic Co-operations and Development (OECD).
Pharma Advertising Restrictions
Only two countries—the US and New Zealand—permit direct-to-consumer (DTC) drug advertising. The FDA has explored new limits on these ads, but so far, the effort has had little impact and faces First Amendment hurdles. Ironically, tighter rules could even help large pharma firms, whose scale and distribution networks already provide a competitive moat. Smaller biotechs, unable to advertise effectively, might find themselves selling assets to bigger players at discounted prices. Given that advertising remains a small expense for our Income-Equity pharma holdings, any policy change here is unlikely to be material.
Advertising Expense as a % of Revenue
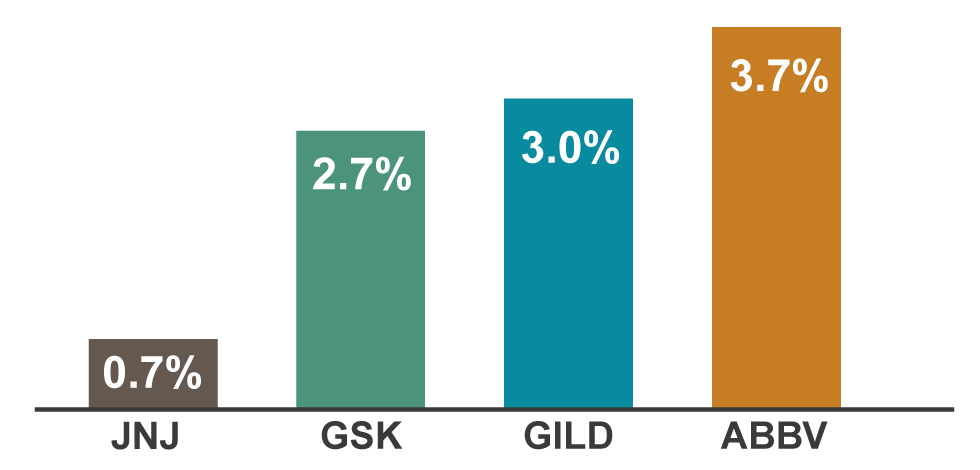
Full year 2024 data as of December 31, 2024. Sources: Company filings; Miller/Howard Research & Analysis. ABBV, GILD, GSK, and JNJ were held in the Income-Equity (No MLPs) portfolio as of September 30, 2025.
Vaccines
Health and Human Services Secretary Robert F Kennedy Jr.'s well-documented skepticism toward vaccines has prompted the administration to revisit certain immunization guidelines. So far, these moves appear modest. Among our holdings, only GSK has meaningful vaccine exposure in the US through its MMRV, RSV, and Hepatitis B programs, and none are involved in the domestic sale of mRNA or COVID-19 vaccines. We expect the CDC’s recent updates to make Hep B vaccinations optional [updated to reflect the December 2025 ACIP meeting] and to separate MMR and varicella shots (rather than use the combined MMRV vaccine) to have a trivial impact, while potential RSV changes remain on hold. Overall, we view renewed public scrutiny as constructive, likely reinforcing long-term confidence in vaccine safety rather than undermining it.
Medicare Restructuring & IRA Price Negotiations
The most financially significant regulatory shift comes from the Inflation Reduction Act's (IRA) reforms to Medicare Part D, which pre-date the current administration but began rolling out in late 2023 with considerable changes starting in 2024 through 2025. These changes require manufacturers to provide discounts and rebates in both the initial and catastrophic coverage phases and cap price hikes at the rate of inflation. For the first time, Medicare can also negotiate “maximum fair prices” (MFP) for select blockbuster drugs, with updated pricing for 25 drugs rolling out by early 2027, and additional negotiations expected to follow. Among our holdings, Johnson & Johnson and AbbVie each have three drugs currently subject to the most recent MFP negotiations, GSK has two, and Gilead none.
The reason these changes haven't hurt pharma valuations this year is simple: Markets have had three years to price them in. In our view, most of the impact is already reflected in current stock price levels. That said, this is the area we're watching most closely. Over time, the government could become more aggressive in setting MFPs, particularly given the nation's fiscal pressures. Commercial insurers may follow suit, seeking similar discounts.
Medicare Part D Redesign

As of October 31, 2025. Sources: Miller/Howard Research & Analysis; BMY Q1 2025 Results Presentation Appendix.
The Bottom Line
We hope this overview clarifies both the opportunities and risks within this vital (if complex) corner of our Income-Equity portfolios. The pharmaceutical industry will certainly keep changing. The Miller/Howard playbook will not. Our fundamental research will continue to answer the same two questions on behalf of our clients: Is the dividend safe, and will it grow?