The Case for Optimism
Monday, October 18, 2021

 The case for optimism centers on the remarkable strength of both the consumer and business sectors.
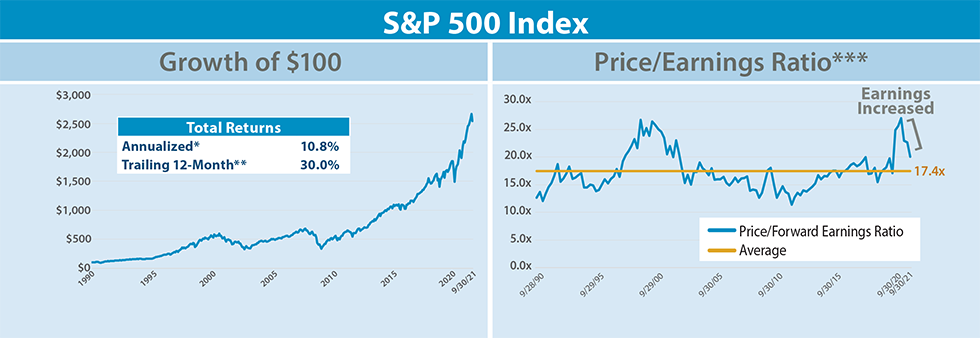
How many times have you heard Wall Street gurus claim that the stock market is in a bubble? To paraphrase the old saw about economists, market pundits have identified ten of the last two stock market bubbles. But we must acknowledge that the recent run in US equities has been spectacular. An investment in the S&P 500 Index in the past 12 months generated an astounding 30% return—well above its longer-term average of 11%. No one argues that returns can continue at this torrid pace, but what is the case for the market turning down for an extended period?
The best bearish arguments focus on valuation and Fed policy. The forward price-to-earnings (P/E) ratio is now at 20x for the broad market (based on the S&P 500), well above the average of 17x we have seen since 1990. But if high P/Es were a reliable sign of a market top, 2021 should have been a down year. Instead, we have seen earnings estimates rise during the year, suggesting that market participants saw a recovery in earnings sooner than Wall Street analysts. High P/Es make returns from multiple expansion less likely going forward, but earnings growth and dividends can still push the market to new highs in our view.
A better bear argument hinges on the Fed tightening monetary policy to fight inflation, either by directly raising the federal funds rate or by tapering its bond-buying program. Inflation numbers have increased recently, and so far, the Fed has viewed this as a temporary phenomenon. Even if inflation does persist, causing the Fed to begin tightening, higher interest rates will not necessarily lead to a prolonged drop in the stock market. Yes, multiples on expensive stocks would likely fall with higher interest rates as earnings in distant years become more discounted. We expect this impact would be offset by the continual payment of dividends and the upward trend in earnings for the broad market driven by economic growth. Earnings in the financial sector would also get a specific boost from higher interest rates. Inflation poses a legitimate threat to P/E multiples, but we believe that earnings growth and dividends should continue to drive healthy market returns, particularly for stocks with moderate valuations.
No one can entirely dismiss bear cases for the market, but what is the case for optimism? When the pandemic finally fades, are we set up for a strong recovery?
|
As of September 30, 2021. Source: Morningstar Direct. |
As of September 30, 2021. Source: Bloomberg. |
The Consumer is Strong
When it comes to the consumer, it really is different this time, at least relative to the 2008 bubble. The consumer drives almost 70% of the US economy and has never been in better shape. Consumer net worth is higher than ever, currently $405,000 per person. A fair pushback would be that this reflects a run-up in home prices. But even cash per capita is at an all-time high at $50,000 per person. Rising asset prices combined with generous government support has left the average consumer with plenty of spending power.
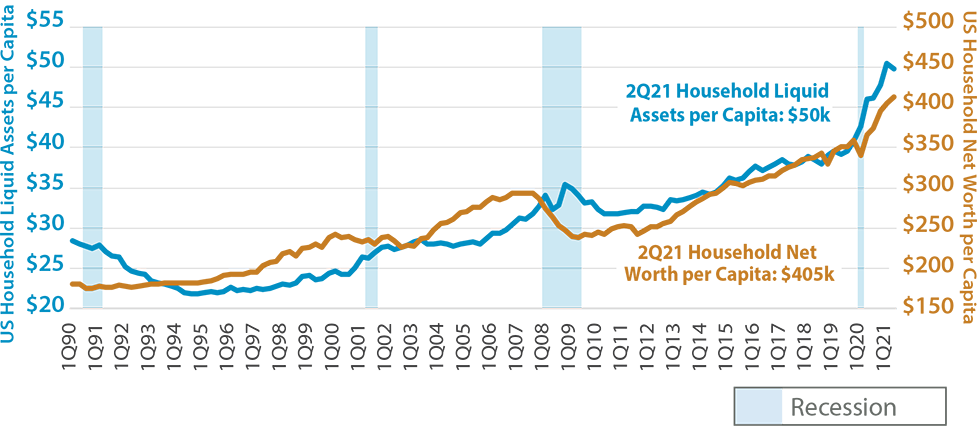
As of June 30, 2021. Sources: Federal Reserve, Bureau of Labor Statistics; Bloomberg.
4Q20 Consumer Price Index = 1. Cash & Cash Equivalents is defined as financial assets that are liquid household deposits.
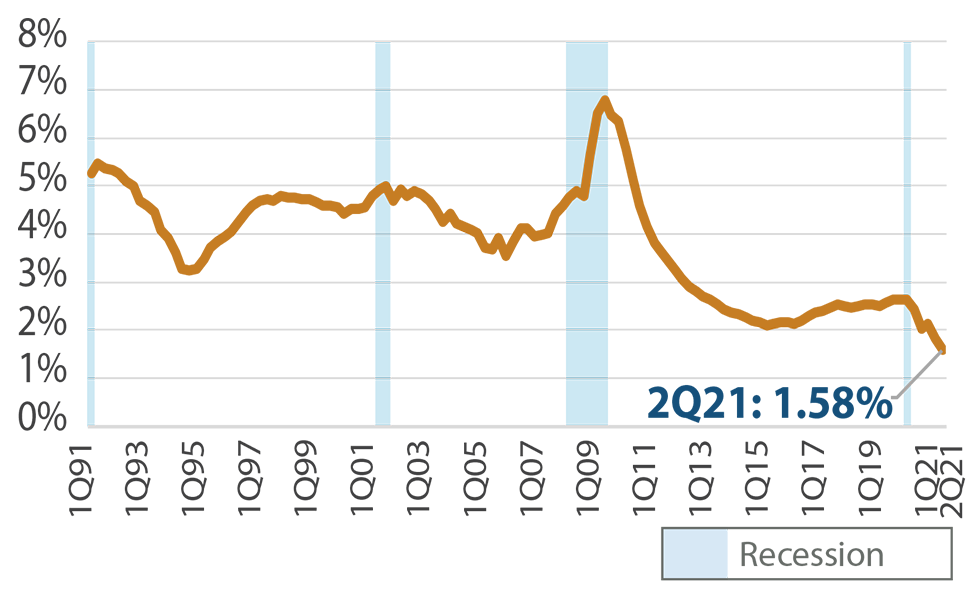
The consumer is also remarkably unencumbered by debt. Looking at the ratio of debt to disposable income, we see that the average consumer has de-levered extensively since 2008. Yet this understates the case because interest rates on consumer debt have also come down significantly. The debt service ratio measures the percentage of disposable income that goes to interest on mortgages and other debt. The graph of the debt service ratio shows how dramatically interest payments have fallen relative to disposable income.
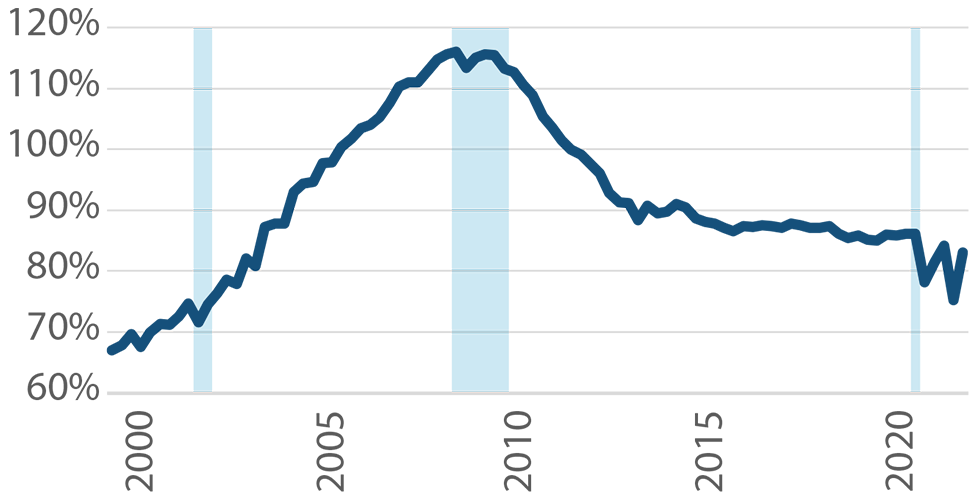

As of June 30, 2021. Source: The Federal Reserve; Bloomberg.

As of March 31, 2021. Source: The Federal Reserve; Bloomberg.
*The household debt service ratio (DSR) is the ratio of total required household debt payments to total disposable income, reported quarterly.
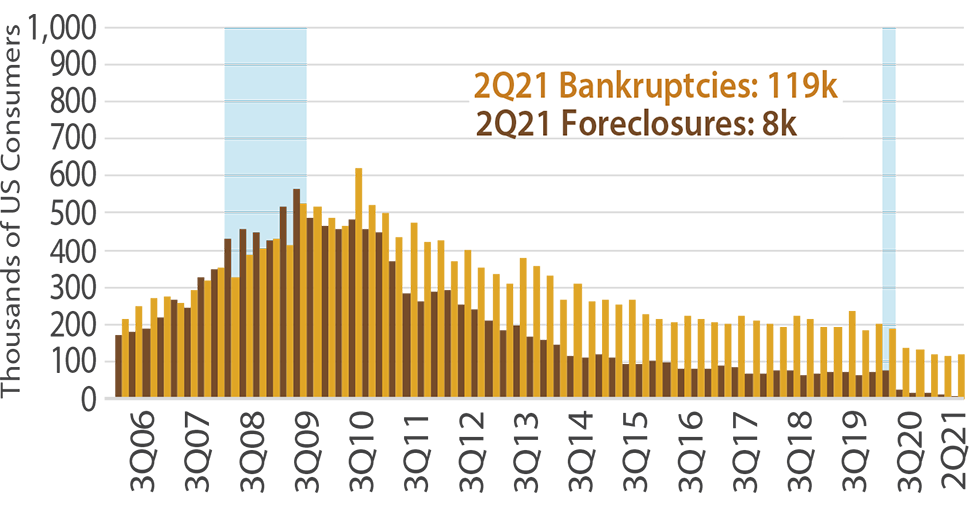
Some argue that statistics on the average consumer are overly influenced by wealthy people and that there is a substantial fraction of consumers in dire straits. We have examined this issue from multiple perspectives and still conclude that even the lower-income consumers are better off than normal. One interesting metric is the percent of consumers with bills at third-party collection agencies. Seven percent of US consumers have bills in collection, typically medical and utility bills. Seven percent still sounds high, but it is roughly half of what it was at the peak in 2013. Many of these bills can be for small amounts. Serious debt problems are best measured by bankruptcies and foreclosures, both of which are at record lows.
But are problems for the consumer just around the corner? A good forward-looking metric is the percent of consumer debt that is 30 days or more delinquent. Thirty days is often just a missed payment but clearly could be the start of a serious downward slide. As the graphs below show, consumer debt delinquency is also at an all-time low.

As of June 30, 2021. Source: New York Fed Consumer Credit Panel/Equifax.
As of June 30, 2021. Source: New York Fed Consumer Credit Panel/Equifax.
As of June 30, 2021. Source: The Federal Reserve
In addition to improvements in consumer balance sheets, the labor market is also steadily getting better. Unemployment dropped to 4.8% in September, continuing the march lower that began in May 2020. Job openings as measured by the Bureau of Labor & Statistics are at an all-time high.
Every way we look at it, we conclude that the consumer is poised to spend in a recovery.
How’s Business?
Earnings announcements have been complicated this year, with many companies reporting strong demand for their products but frequently complaining about supply chain disruptions. Our focus here, however, is on the overall health of the business sector. Are companies well-situated for a recovery?
Business was impacted by the pandemic, arguably more than the consumer. The Bloomberg Bankruptcy Index rose substantially last year, but it was nowhere close to what we witnessed following 2008. Bankruptcies in 2021 have dropped to one of lowest levels ever, suggesting that the shakeout is over.

Source: Bloomberg, last updated September 24, 2021.
The Bloomberg Corporate Bankruptcy Index measures both the occurrence and severity of current and recent US bankruptcy activity for corporations with at least $50 million in reported liabilities. The index is a barometer of bankruptcy activity that equally considers the number of bankruptcies and the US dollar amount of liabilities relative to their 2000 to 2012 medians which are set at 100. Each known bankruptcy observation is discounted daily from a full weighting to zero over the following year.
Positive indications also come from the performance of commercial and industrial loans at US banks. Both delinquencies and defaults are at low levels. Overall, it appears that US business has the financial strength to shift into high gear as normal life returns.

As of June 30, 2021. Source: The Federal Reserve. Commercial and industrial loans exclude leases and real estate.
COVID-19 Headwinds Should Abate
Both the consumer and the business sector are well-positioned for a recovery, but the economy will continue to be choppy as long as COVID-19 restricts normal activity. While some parts of the economy have returned to normal, the pandemic continues to disrupt domestic industries such as healthcare, retail, travel, and hospitality, as well as creating havoc with global supply chains. The spread of the virus has been difficult to predict, but evidence suggests we are approaching the final stage.
First, the vaccine has been very effective. One way to see that is to examine the current case rates for all 50 states versus the percent of the population that is vaccinated. Higher vaccination rates are clearly associated with lower new case rates. Other factors, however, are also at work. Sending children back to school is arguably our most decisive move towards normalization. Despite best efforts, children will contract COVID-19 and bring it home. We have seen spikes in cases following the first day of school in many places across the country. States with later school starts, such as those in the Northeast, may have a new wave of COVID-19 cases despite higher vaccination rates.
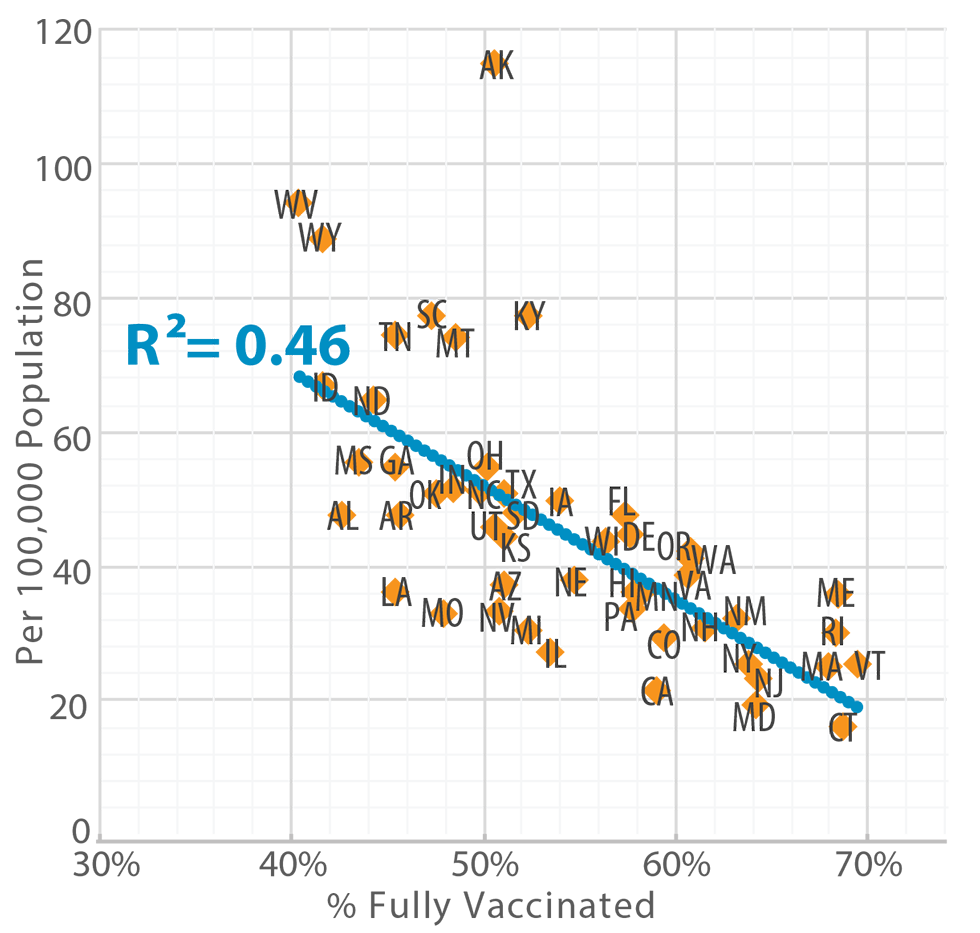
As of September 30, 2021. Source: Centers for Disease Control and Prevention (CDC); Miller/Howard Research & Analysis.
The good news is that effect seems to be waning for the states with the earliest starting dates. Looking at new case rates over time for Alabama, Indiana, Hawaii, and Arizona, new case rates have already fallen off their peaks.

As of September 30, 2021. Source: Centers for Disease Control and Prevention (CDC); Miller/Howard Research & Analysis.
Seven-day moving average. School starts were researched using state and municipal school district public resources as well as the Public Holidays Global website.
The main reason why we believe the end of the pandemic is on the horizon is that the virus is running out of people to infect. At quarter-end, 56% of Americans were fully vaccinated and this number continues to grow. Vaccinated people can be infected, but the rate is very low, particularly for severe cases. People can also gain immunity by contracting the virus. Reinfections have been reported but are still rare. Estimating the cumulative number of cases is difficult because many people either have no symptoms or a mild enough case that they never get tested. The Center for Disease Control estimates that only 1 in 4.2 cases is reported. This implies that 55% of Americans have already had COVID-19. Adjusting for people who contracted the virus and then were vaccinated, we estimate that 83% of the US population may now have reasonably good immunity, either through vaccination, infection, or both.
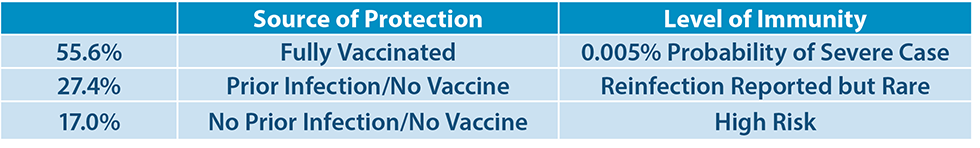
As of September 30, 2021. Source: Centers for Disease Control and Prevention (CDC); Miller/Howard Research & Analysis.
Everyday, more Americans get vaccinated or contract COVID-19. At current rates, another 1% of Americans gain some level of immunity every two weeks. Given that we estimate that only 17% of Americans were at high risk (no vaccine and no prior case) at the end of the quarter, we are approaching the point at which the virus will struggle to find victims who are easy to infect. Once case rates drop in earnest, most people will view the risk of infection as tolerable, analogous to the flu or the common cold. At that point, we believe economic activity should normalize.
The biggest caveat to this conclusion is that it depends on the virus not mutating in a way that undermines the effectiveness of vaccines or prior infections. We continue to monitor this issue, but currently, our view is that we are months rather than years away from the end of the pandemic.
But Markets are Already Up!
A reasonable rebuttal to our optimism would be that broad market returns have been well above average, even during the worst pandemic in 100 years. How crazy is that? At Miller/Howard, we view earnings growth and dividends as the high-quality sources of stock market returns. Fluctuations in P/E multiples can significantly impact returns in a particular year, but as we have written (see Miller/Howard Quarterly 1Q 2021), P/E multiples are fickle and unlikely to be a sustainable source of investment returns over the long term.
Keeping this framework in mind, returns in 2021 have been driven by the sustainable factors—earnings growth and dividends. Earnings have grown tremendously off an admittedly weak 2020. P/E multiples have actually contracted this year as earnings have grown faster than stock prices. Valuations are more palatable now than at the beginning of the year.

As of September 30, 2021. Source: Bloomberg; Miller/Howard Research & Analysis.
The case for optimism centers on the remarkable strength of both the consumer and business sectors. Factors such as the Delta variant or supply chain disruptions may cause short-term delays in the recovery, but once the recovery comes, the economy is primed to be strong.
Given this setup, are equities a good buy at current prices?
Let’s start by comparing stocks and bonds, the two large, liquid asset classes on the investor menu. Bonds are easy to value – the interest rate is the buy-and-hold return. One simple way to compare the return on equities to bonds is to look at the dividend yield on equities. Currently, the dividend yield on the broad market is roughly the same as the interest rate on the 10-year Treasury. Thirty years ago, the interest rate on the 10-year Treasury was substantially higher than the S&P 500’s dividend yield. Put simply, bond investors required the higher interest rates to compensate for the lack of growth. Now, markets have evolved to the point where the interest rate on the 10-year Treasury is roughly the same as the dividend yield on the broad stock market, even though bonds still do not offer any income growth. Through the dividend lens, even the modest yield of the S&P 500 looks attractive.


As of September 30, 2021. Source: Bloomberg; Miller/Howard Research & Analysis.
A better valuation metric for comparing equities to bonds is the earnings yield, or the inverse of the P/E multiple. Some might argue that dividends should be the metric to compare to bond coupons. After all, dividends and bond coupons are both “money in your pocket.” As much as we like dividends at Miller/Howard, we view earnings as the right comparison. The portion of earnings not paid as dividends provide companies with the capital to grow earnings and dividends in the future. Thirty years ago, the earnings yield on the S&P 500 was roughly the same as the 10-year Treasury interest rate, suggesting investors thought that the growth prospects for equities offset the risks involved. Now, the spread between the equity earnings yield and Treasury rate has ballooned out, offering investors substantially more earnings in equities relative to bond interest, again leading to the conclusion that equities are attractive relative to bonds.
This is just the defense of equities as an asset class. The favorable points above can be dialed up with the right portfolio exposures. Miller/Howard strategies have substantially higher earnings yields and dividend yields relative to the broad market, making them, in our view, a good place to put money to work in a recovery.
Worries about the broad equity market are understandable, but fixed income alternatives suffer in a low interest rate environment. Buy-and-hold investors in high dividend yield stocks have done better over 10-year holding periods than the S&P 500 and bond alternatives. (See our 2021 Q2 Quarterly, page 6.) In our view, today’s entry point for dividend investors is particularly attractive given the setup for a recovery and current valuations.
Read the 2021 Q3 Quarterly Report ►

Emeritus CIO
